
Kruskal's algorithm
1. Original procedure of the algorithm
Kruskal's algorithm is used to find the minimal spanning tree of a graph. We work with a weighted undirected graph $G = (V, E, w)$ where $V$ is a set of nodes, $E$ is a set of undirected edges and $w$ is a positive weight of any edge.
- At the beginning of the algorithm initialize a subgraph $T = (V, \infty)$ containing all the nodes of the graph $G$ and an empty set of edges (At the termination of the algorithm the subgraph $T$ becomes a minimum spanning tree of the graph $G$.).
- Sort the edges of the graph $G$ according to their weight and process them consecutively from the shortest one.
- Check if addition of the current edge to the subgraph $T$ establishes a cycle.
- If not, add the edge to the subgraph $T$.
- Otherwise, do not add the edge to the subgraph $T$.
- After processing the last edge the subgraph $T$ becomes the minimum spanning tree of the graph $G$.
When processing the algorithm in the standard way we work with a visual representation of a graph. When adding an edge to the subgraph $T$ we highlight it directly in the graph (using a different color or any other means of highlighting). There is a graph $H$ with seven nodes in Image 1 demonstrating the situation before processing the fourth edge between the nodes $D$ and $G$. After the first three steps of the algorithm the edges $CF$, $DE$, $CD$ were added to the subgraph $T$. The next one $(DG)$ does not establish a cycle and therefore we can add it to the subgraph $T$ as well.
Example 1: Weighted undirected graph $H$
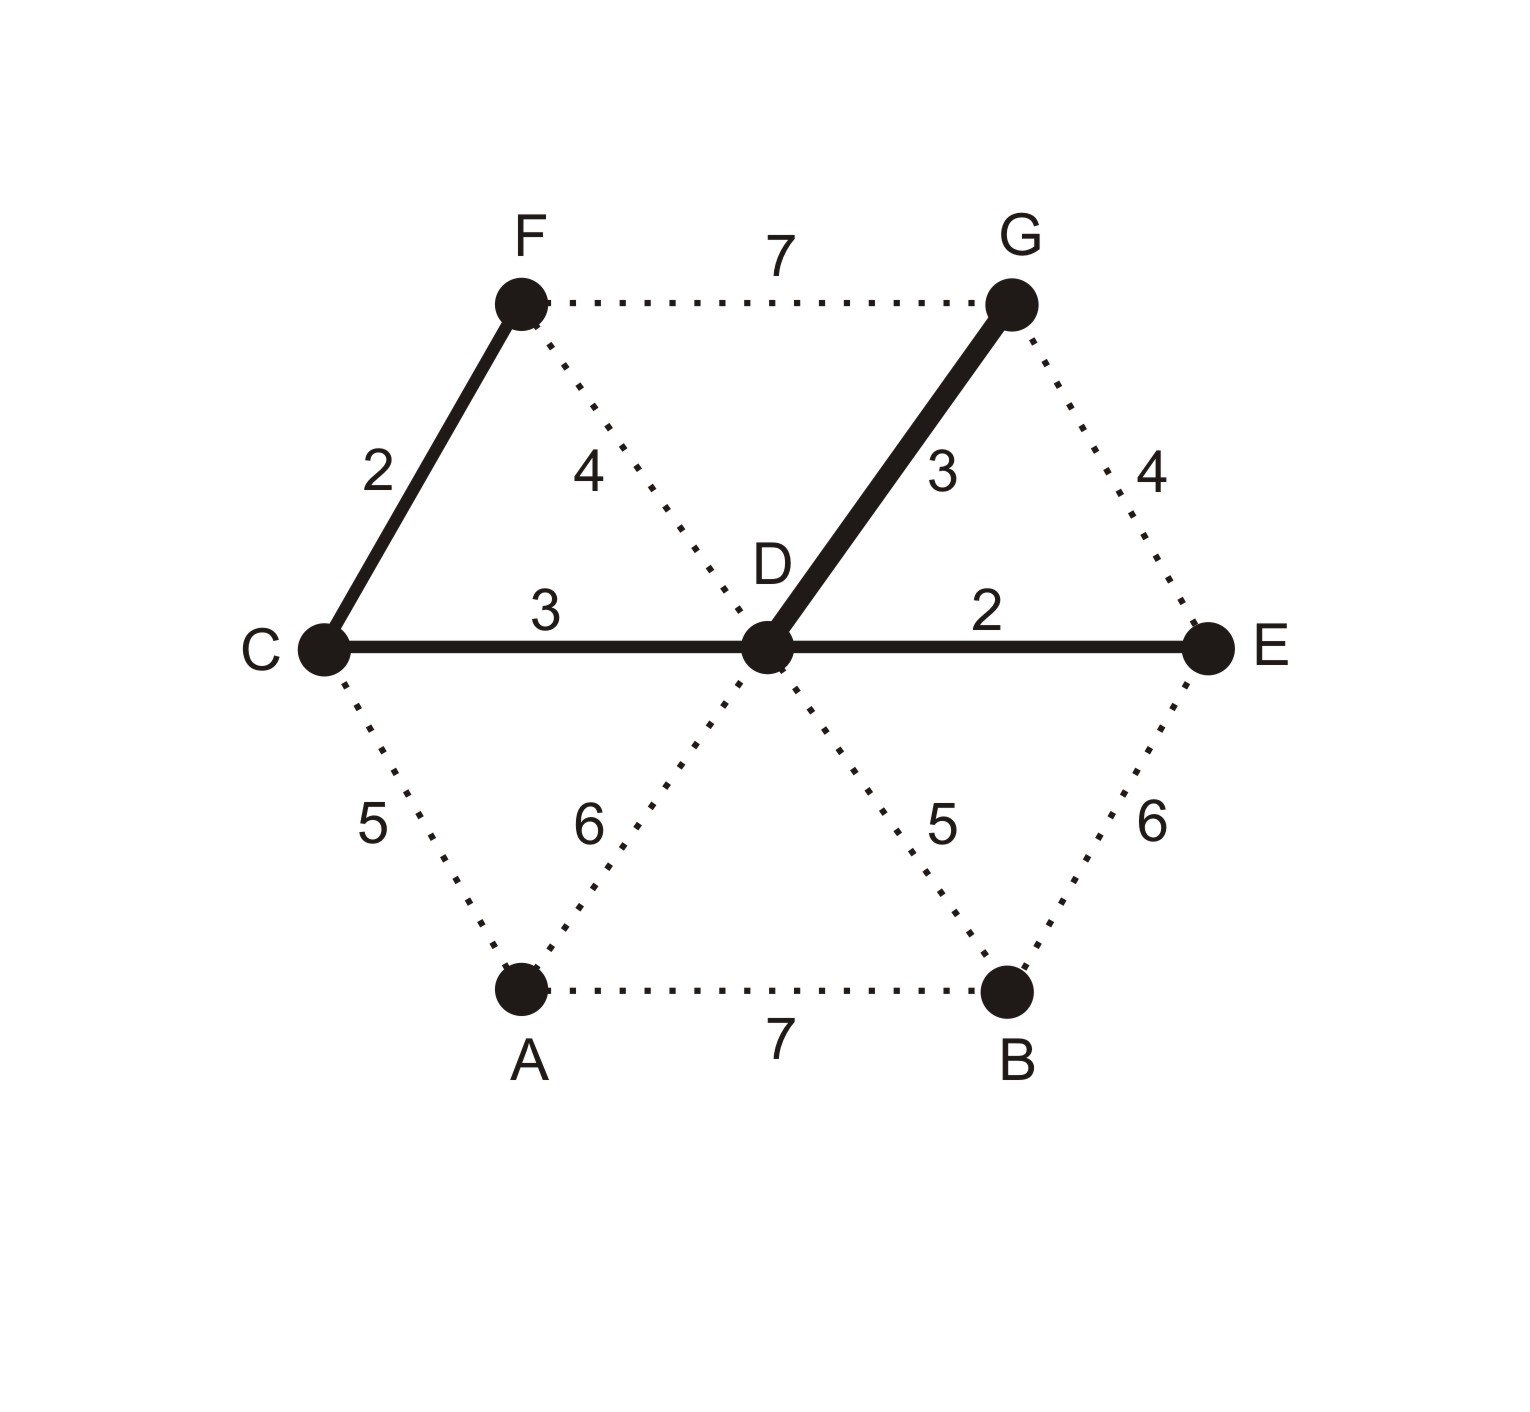 Image 1:
Weighted undirected graph $H$,
highlighting edges of the subgraph $T$
and a currently processed edge
Image 1:
Weighted undirected graph $H$,
highlighting edges of the subgraph $T$
and a currently processed edge
We cannot add the next two edges of the weight $4$ to the subgraph $T$ because they would both establish a cycle of the size $3$ (tripple of the nodes $C, D, F$ or $D, E, G$).
To demonstrate Kruskal's algorithm we come with an Animation 2 of the computation and use a concrete weighted undirected graph.
2. Proposals of adaptation
1. Edges of a graph are organized in a table according to nodes, and a subgraph is created in another document (sheet):
The graph is converted to a table. We add labels of the nodes to the first column. All the other cells on the row for a node $X$ are reserved for the edges coming out from $X$ and are written as $X$–$n$–$Y$ where $n$ is a weight of the edge and $Y$ is the end node of the edge. We use another sheet or a separate text file:
- to add the edges of the subgraph $T$ consecutively.
- to organize sets of nodes connected together by existing edges of the subgraph $T$.
Let's take the same graph $H$ with seven nodes illustrated in Image 2. The following two tables (see Table 1 and Table 2) demonstrate the situation after addition of the first two edges to the subgraph $T$.
Example 2: Graph $H$ from Image 1 converted to a table
| $A$ | $A$–$5$–$C$ | $A$–$6$–$D$ | $A$–$7$–$B$ | |||
| $B$ | $B$–$5$–$D$ | $B$–$6$–$E$ | $B$–$7$–$A$ | |||
| $C$ | $C$–$3$–$D$ | $C$–$5$–$A$ | ||||
| $D$ | $D$–$3$–$C$ | $D$–$3$–$G$ | $D$–$4$–$F$ | $D$–$5$–$B$ | $D$–$6$–$A$ | |
| $E$ | $E$–$4$–$G$ | $E$–$6$–$B$ | ||||
| $F$ | $F$–$4$–$D$ | $F$–$7$–$G$ | ||||
| $G$ | $G$–$3$–$D$ | $G$–$4$–$E$ | $G$–$7$–$F$ |
Example 3: Subgraph $T$ (the future minimum spanning tree)
The last table demonstrates the following fact. The first two edges of the subgraph $T$ connect two sets of nodes $ \{ C, F \}$ and $ \{ D, E \}$. Before adding the next edge $C$–$3$–$D$ we have to check if it does not imply a new cycle at the subgraph $T$. A sighted student checks that visually while a blind one does so by organizing sets of nodes connected together by edges of the subgraph $T$. If both nodes of a processed edge belong to the same set of nodes, he/she immediately knows a cycle is going to be created. Otherwise he/she can update the Table 3, add the processed edge to the subgraph $T$ and modify the sets of nodes connected together. He/she should not forget the currently processed edge was kept in the Table 2 twice therefore it is necessary to delete it at both places.
2. Edges are organized in two rows of a table, a subgraph is created in another document (sheet):
The graph is again converted to a table but edges are organized differently. They are completely described in the first column as strings $x$–$n$–$y$ where symbols $x, y$ indicate nodes connected by an edge with a weight $n$. The second column serves to repeat the weight of the edge. Such an organization of the edges is demonstrated in Table 3.
Example 4: Graph edges organized in two columns
Most of the spreadsheet applications enable users to arrange data according to values of a certain column. Therefore a blind student can sort edges in ascending order with regard to weights kept in the second column. To consecutively prepare the subgraph $T$ and sets of nodes connected by the subgraph's edges we use the second sheet or a separate document. We process the algorithm in the same manner as previously.
3. Discussion of pros and cons
Let us state in advance that blind students find the second method of adaptation better. There are three main reasons for that:
- they can immediately find the edge which should processed;
- they spend less time moving the cursor between rows and columns of the table;
- they do not need to delete the processed edge twice.
When using the first method they have difficulties finding the edge with the lowest weight. They can solve the problem if they search for them by finding strings as "–$1$–", "–$2$–", etc. One of the students came up with a proposal to leave the concept of the graph representation by means of a table and use the same arrangement of edges in any plain text editor. Edges of a certain node would be positioned on a line separated by commas or spaces. In that case blind students can use keyboard shortcuts or a refreshable braille display and its functions to work with a text effectively.