
Dijkstra's algorithm
1. Original procedure of the algorithm
Dijkstra's algorithm is used to find the shortest path from the initial node $A$ to all the other nodes of a graph. We work with a weighted undirected graph $G= (V, E, w)$ , where $V$ is a set of nodes, $E$ is a set of undirected edges and $w$ is a weight of any edge. At the beginning of the algorithm we add the value "$A/0$" to the label of the initial node $A$ and "$X/\infty$" to labels of all the other nodes $X$ with unknown distance from $A$. We demonstrate a graph of this type in Image 1.
Example 1: Undirected graph $G$
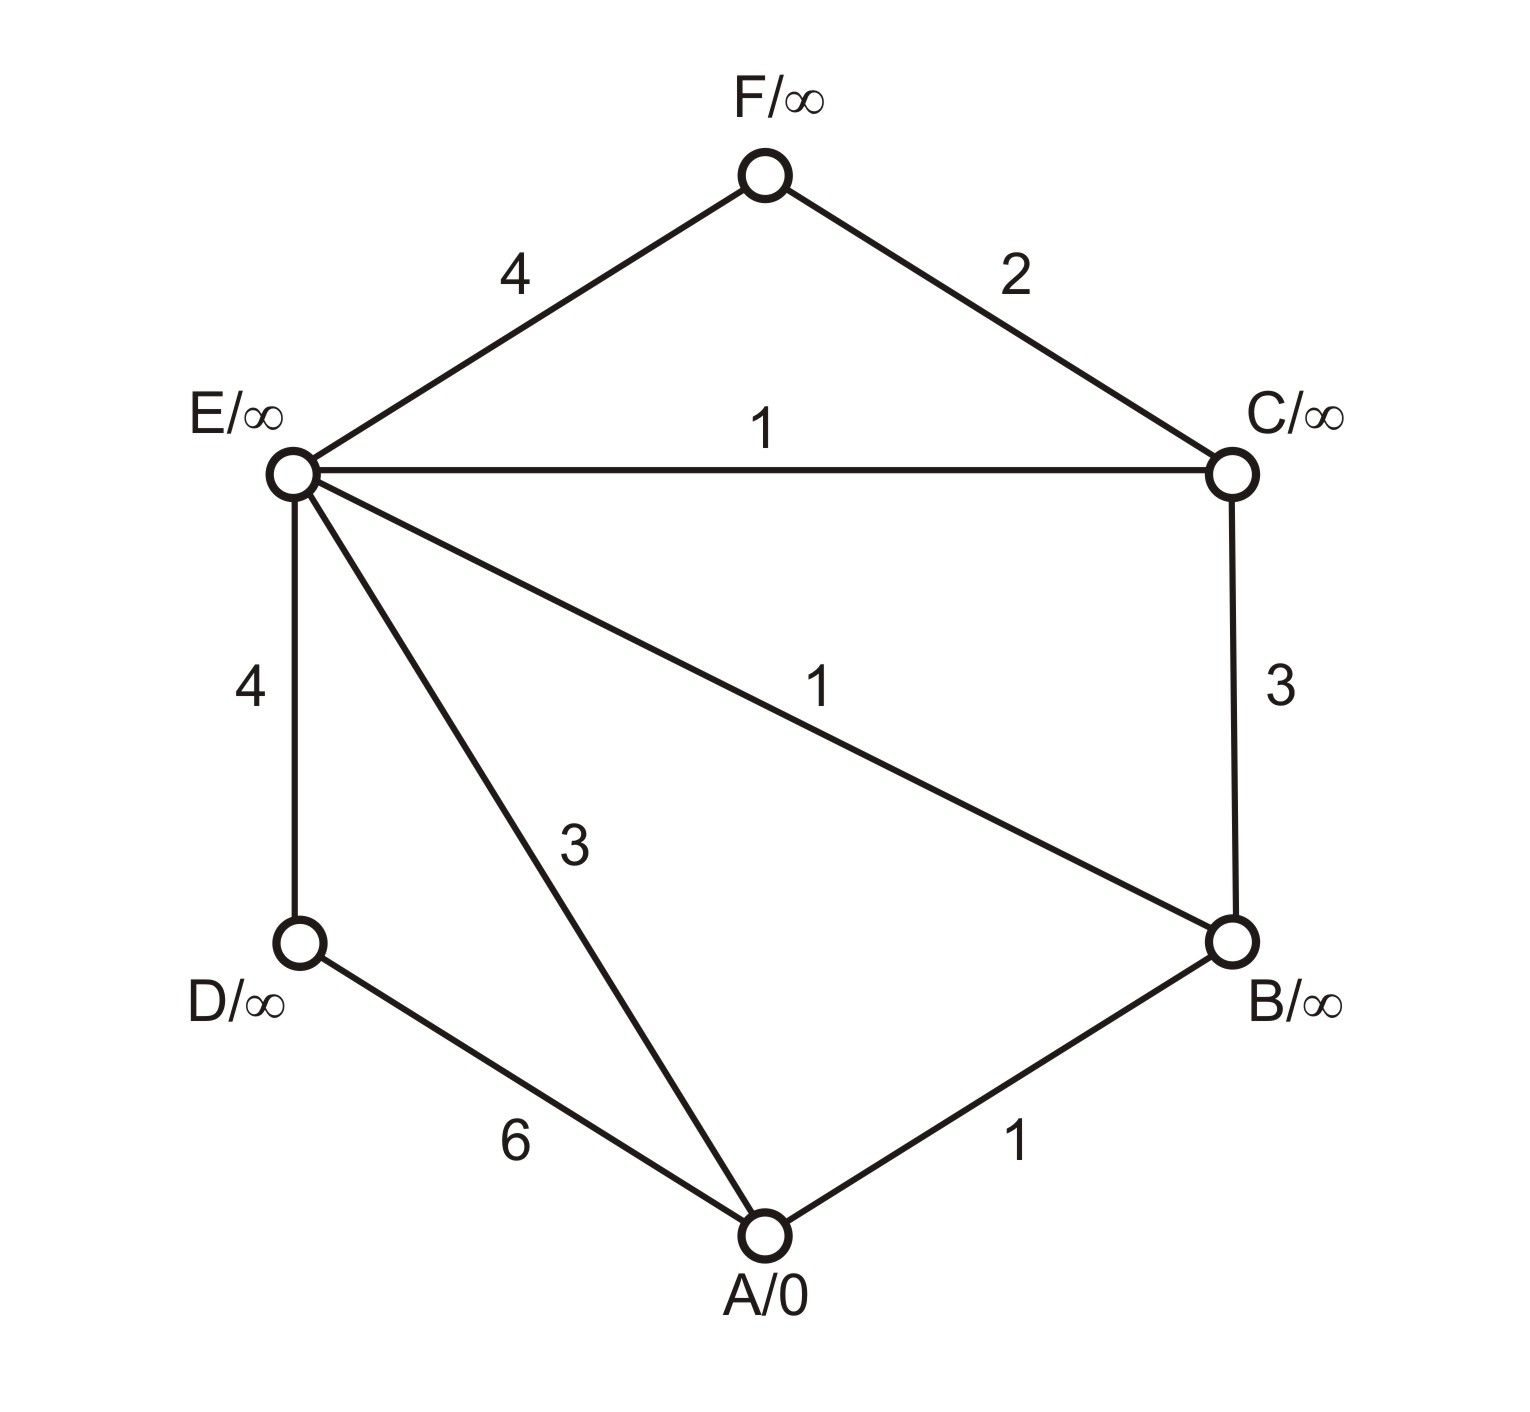 Image 1: Undirected graph $G$ with six nodes and
edges weighted by positive real numbers
Image 1: Undirected graph $G$ with six nodes and
edges weighted by positive real numbers
We repeat performing the following three steps until we cannot process any other node:
- Select the unvisited node "$X/n$" with the smallest tentative distance $n$ from the initial node $A$.
- Perform the following two steps for every edge $e$ coming out from
the node "$X/n$"
to any unvisited node "$Y/m$":
- if $m > n + w(e)$, modify the current tentative distance of the node $Y$ to $m = n + w(e)$,
- otherwise keep the label of the node $Y$ as it is.
- Mark the node $X$ as visited.
When performing Dijkstra's algorithm we change labels of nodes only. We update their current tentative distance from the initial node or we mark them as visited. To demonstrate Dijkstra's algorithm we come with an Animation 1 of the computation and use a concrete weighted undirected graph.
2. Proposals of adaptation
1. Work with a graph on a sheet of a spreadsheet:
We add labels of all the nodes to the first column starting with the initial node. All the other cells on the row for a node $X$ are reserved for edges coming out from $X$ and are written as $n$–$Y$ where $n$ is a weight of the edge and $Y$ is the end node of the edge, see Table 1.
Example 3: Table representation of the graph $G$ from Image 1
| $A/0$ | $1$–$B$ | $3$–$E$ | $6$–$D$ | ||
| $B/\infty$ | $1$–$A$ | $1$–$E$ | $3$–$C$ | ||
| $C/\infty$ | $1$–$E$ | $2$–$F$ | $3$–$B$ | ||
| $D/\infty$ | $4$–$E$ | $6$–$A$ | |||
| $E/\infty$ | $1$–$B$ | $1$–$C$ | $3$–$A$ | $4$–$D$ | $4$–$F$ |
| $F/\infty$ | $2$–$C$ | $4$–$E$ |
We modify labels of the nodes in the first column, values of the other columns are to be read only. We mark visited nodes by asterisk to avoid proceeding them in the following steps of the algorithm. We finish the algorithm when all the nodes are marked by asterisk (they are all visited).
2. Work with a graph on two sheets of a spreadsheet:
There is only one change in comparison with the first method of adaptation. We use the first sheet to explore edges whereas the second sheet includes only one column with the nodes' labels to be consecutively modified.
3. Work with a tactile version of a graph, use of any editor to modify tentative distances of nodes:
The method is similar to the previous one and differs only in representation of the graph which is offered as a tactile image. A student combines tactile reading of the graph with editing labels of nodes written in any text editor or spreadsheet.
3. Discussion of pros and cons
It is clear the first method is advantageous to teachers. The graph is well arranged and understandable, all the nodes and edges are in one place. Nevertheless, blind students do not find the method good. Performing the algorithm is not effective because of the frequent movement between rows and columns of one sheet of the table.
The second method eliminates the disadvantage. When switching from one sheet to another the cursor remains in the same position as it was previously and therefore a user gets all the processed data immediately without searching for them for a long time. Furthermore, the second method is more economical concerning memory requirements. When switching between the two sheets the student needs to hold only the tentative distance of the current node from the initial one n his/her memory. All the other data s/he needs (the weight of the edge and the successor's identification or its current tentative distance from the initial node) are easily and quickly accessible. One of the blind students came with an interesting proposal of improvement: "I could change the name of the sheet and put there the information about currently processed node. I have it on my refreshable braille display all the time I work with the sheet, therefore I need not keep it in my memory." We also recommend teachers to provide students with a spreadsheet file containing two sheets only, one for reading the graph, the second for editing labels of the nodes. Otherwise blind users may switch (by mistake) to the other sheet with irrelevant data and can become confused easily.
The third method respects the spatial arrangement of the graph preferred by sighted users of the algorithm and blind ones assessed it as the best one too. "I prefer working with a tactile version of the graph. One gets a better idea of the relationships between nodes. When working with the graph in a table, nodes are arranged alphabetically even though they need not be neighbours," said one of the visually impaired students of our university. All the experienced blind users came up independently with a proposal to write nodes on one line of a plain text editor instead of separating them, each node on one line, which was recommended first. As they have a refreshable braille display they can immediately observe all the (un)visited nodes. However, the third method presumes students with the knowledge of Braille and their ability to work with tactile materials.